
By J. W. Storm van LEEUWEN
Member of the Nuclear Consulting Group
And Didier PILLET
Member of the General Economic Council
Uranium is the only metal used as energy source.1 The extraction of uranium from the Earth’s crust involves a complex chain of physical and chemical separation processes and the consumption of large quantities of energy, and of different chemicals.
The energy and chemicals consumed during extraction increase exponentially with decreasing ore grade, accompanied by an exponentially increasing emission of CO2. The grades of the available uranium resources decrease with time, because the mining companies mine the richest resources first, and because these offer the highest return of investment. Above phenomena cause the existence of the “energy cliff” and the “CO2
trap”. They thus call into question, for the century to come, the viability of a nuclear based solely on 235U extracted from natural uranium whose geological occurence couldn’t suffice to make it self-evidently an energy resource.
One way to overcome this 235U limitation would be to exploit 238U resources. Nevertheless, this requires the industrial development and worldwide deployment of reactors operating in fast neutron mode (e.g. FNR). However a significant share of the energy produced by such reactors is difficult to envisage at a world level before the end of this century, as we shall see in this article.
Introduction – Purpose of the article
When we talk about the civil use of uranium, we are of course thinking of energy production, and particu-
larly electricity production, which is the almost exclusive application of uranium in this sector. Currently, the
fleet of reactors in operation worldwide is based on the fission of 235U. This isotope of uranium represents
0.7% of natural uranium, while the remaining 99.3% is composed of 238U, which is envisaged for energy use in the context of the deployment of future generation IV reactors, known as “fast neutron reactors” (or FNR), as opposed to current reactors which operate in a thermal neutron regime. The main advantage of FNR lies in the energy potential they would allow by exploiting 238U, thus multiplying by a factor of about 100 the amount of energy produced, compared to the exploitation of 235U alone.
In France, the lessons learned from the work carried out in the field of fast reactors are largely due to the
feedback from the operation of the Phénix reactor, an industrial demonstrator with an electrical power of
250 MWe, connected to the grid between 1973 and 2010, and whose material balances made it possible
to establish a rate of 239Pu overgeneration of 1.16. The practical implementation of fast reactors has thus been demonstrated in France on a pre-industrial scale. More recently, a French programme called ASTRID (FNR-Na reactor) was launched in 2010, one of the objectives of which was to resolve a problem of core instability in case of coolant loss. It was initially intended to lead to a pilot, but the decision was taken in the summer of 2019 to terminate the project.
Outside France, several prototypes or industrial pilots of the FNR type have been built in recent decades. Of particular note are the Russian BN600 and BN800 demonstrators, commissioned in April 1980 and June
2014 respectively, and still in operation. In addition, new generation IV reactors are currently under study in
several countries, notably in China and Russia. However, what has to be noticed is that after decades of
research in seven countries (USA, UK, France among others), along with investments of some 100 billion
dollars, the breeder concept didn’t go beyond the pre-industrial level. Therefore, the global deployment of FNR technology is still not in sight and will most likely not be effective at large scale before the end of this century, as explained below. During this transition period, nuclear electricity production will thus again rely mainly on 235U, and the question of the availability of natural uranium by 2100 is therefore raised.
So, after recalling some available figures on the world’s uranium resources, and providing some details on the main techniques for exploiting uranium deposits, this article will analyse the geological factors likely to limit the associated energy yield rates, as well as the expected consequences, for this century, in terms of limiting greenhouse gas emissions. Finally, some considerations on the prospects for the deployment of FNR technology in France, and on a global scale will also be presented.
It should also be noted that this article only deals with physical limits on a global scale, without taking into
account the geostrategic stakes of the main countries for access to mineral resources.
About recoverable uranium resources
In terms of natural uranium resources, while the base-line data used in this article is not the most recent,
having been established by the IAEA, OECD and NEA in 2008 [22], this has relatively little impact here as the
objective of the article is not to establish precisely the current state of uranium resources, but, as said in the
introduction, it is more on the limiting factors of its production in the foreseable future.
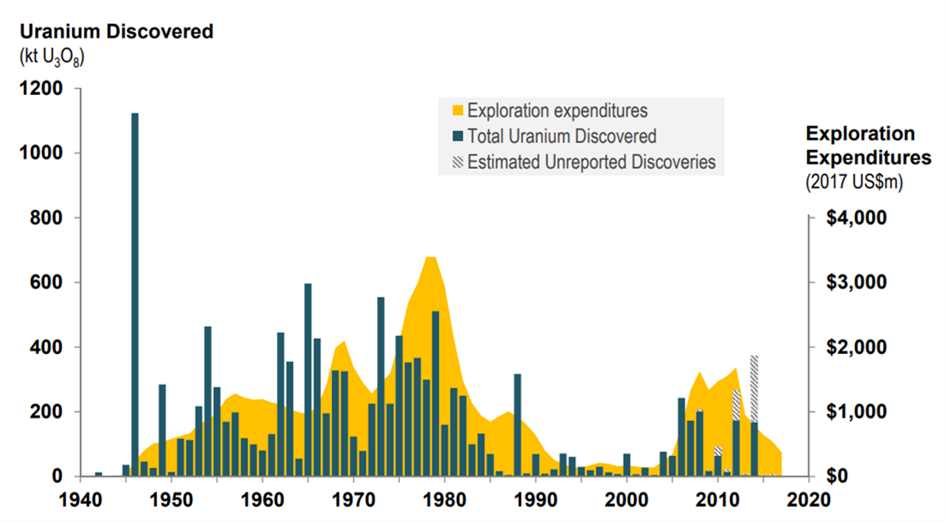
Nevertheless, the total amount of uranium represented by this diagram, wich is 5.469 Tg (1 teragram = 1 million metric tonnes), corresponding with the total resources (RAR + Inferred cost category up to 130 USD/kg U), is quite similar to the 2022 Red Book [23] figures which states 6.078 Tg, partly due to the fact that during the past decades no large new recoverable uranium deposits have been discovered as illustrated below (Figure 1).
Practically, the nuclear industry distinguishes some- times two categories of uranium resources, based on
economic considerations: conventional and unconventional resources. Conventional resources are deposits
of the kind now being mined, and, when uranium can be extracted in an economic way, the rock containing this uranium is called “ore” which is then an economic notion. As far as unconventional resources are concerned, they are resources from which uranium is only recoverable as a minor by-product, such as uranium associated with phosphate rocks, non-ferrous ores, carbonatite, black shale and lignite.
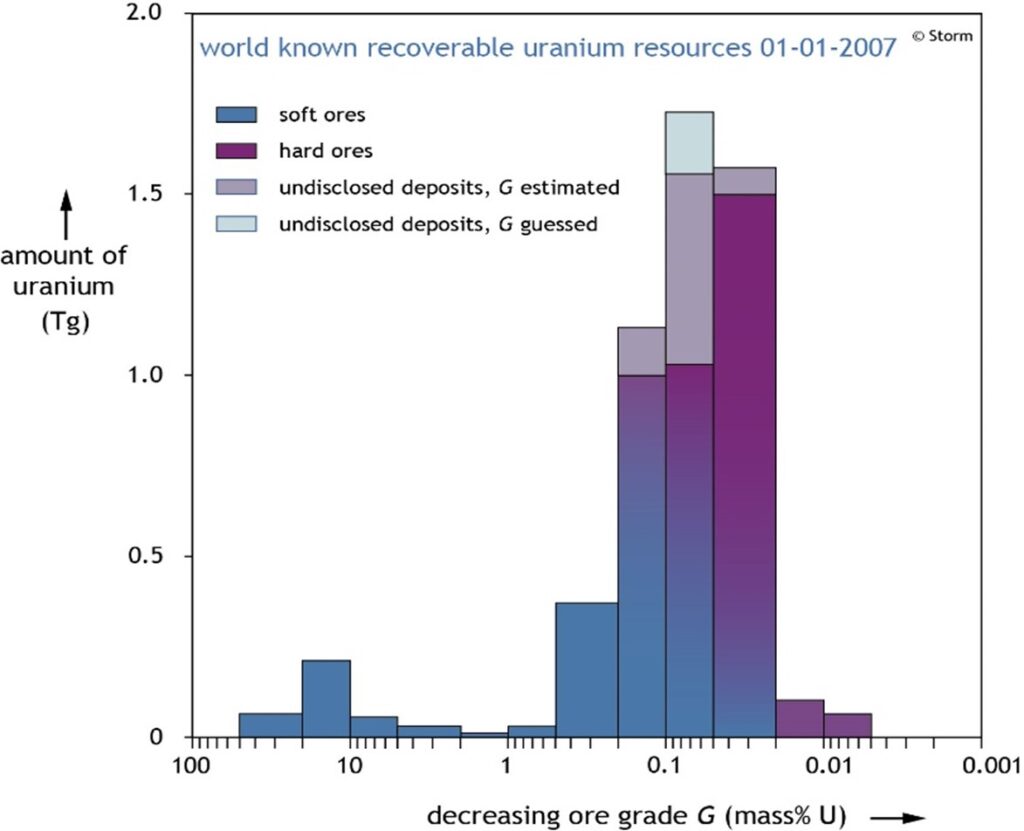
In addition, uranium occurs in many kinds of minerals in the earth’s crust. In this article the conventional ores are divided into two groups (Figure 2):
• soft ores, easily mineable and millable, e.g. sandstones and calcretes, with typical grades ranging
from more than 10% down to about 0.02% U3O8;
• hard ores, hard to mine and mill, e.g. quartz pebble conglomerates, with grades varying typically from
about 0.1% down to the mineralisation limit (see box here-after). Some high-grade vein-type ores are also
hard to mill.
Main processing methods
currently used
It should be noted that, in addition to the declared
resources, the Red Book generally also mentions the
processing method envisaged for their uranium extrac-
tion. These types of exploitation, of which there are
three, are briefly as follows.
Open pit mining
This processing method involves extracting rock or
minerals from an open pit. In this respect, it is important
to take into account the thickness of the upper layers of
waste rock in order to estimate the mining costs, and
the economics of the project.
Underground mining
This is a processing method used when any ore body
lies a considerable distance below the surface, and
especially when the amount of waste that has to be
removed in order to uncover the ore through surface
mining becomes economically prohibitive.
In Situ Leaching (ISL)
This processing method, also known as in situ recovery (ISR) in North America, involves leaving the ore where
it is in the ground, and recovering the minerals from it by dissolving them and pumping the pregnant solution to the surface where the minerals can be recovered.
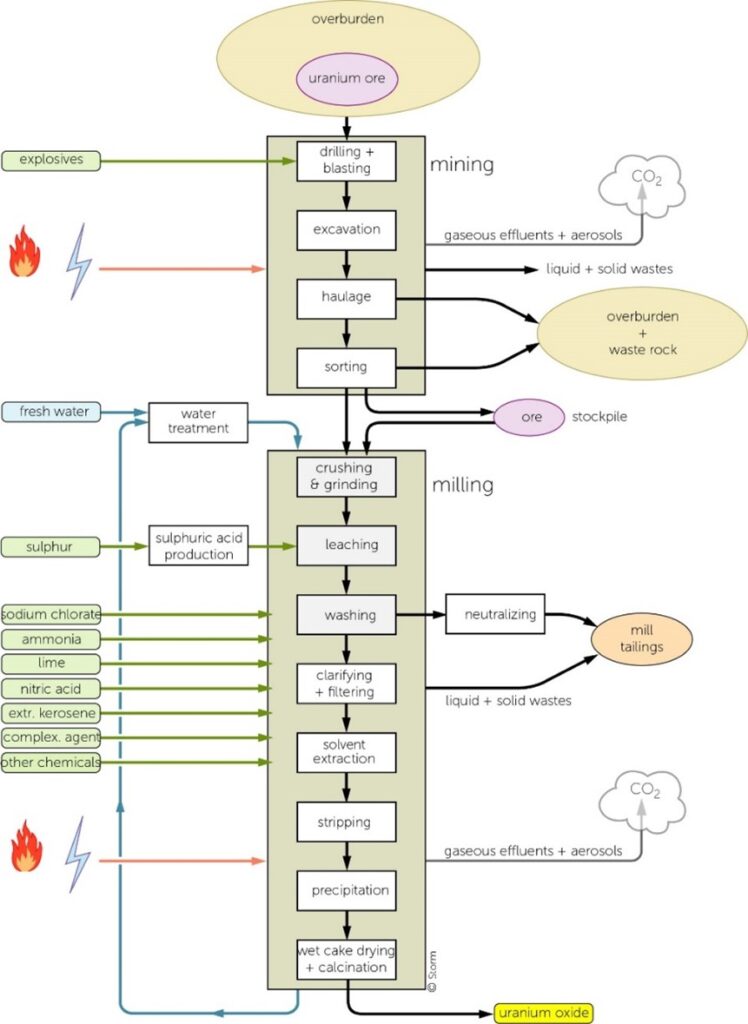
In general, the extraction of any metal from its ore involves a number of physical transformations and chemical equilibria (Figure 4), all governed by basic physical and chemical laws, which cannot be circumvented by technology. In particular, from the Second Law of thermo-dynamics, it follows that separation never can be complete, and there always will be losses in the processes.
For this article, the reference uranium mine is the Ranger mine, an open pit mine that may be taken as
a world-averaged mine.2 Underground mining is generallly more energy intensive than open pit mining.
Differences in specific energy consumption and CO2 emissions between individual uranium mines are substantial, due to widely varying conditions.
It should also be noted that mines applying the In Situ Leaching (ISL) method have, in some respects, a
different flowsheet. Nevertheless, the specific energy consumption and accompanying CO2 emission of ISL
mines may be considered similar to those of open-pit mines, as large numbers of injection and production
wells are to be drilled due to clogging, and as large volumes of leaching liquids are consumed. In addi-
tion, apart from energy consideration, the harmful impact of ISL on the environment can be high [40] and
irreversible.
Extraction yield,
as a function of the ore grade
Basically, the industrial processes to extract metal from the Earth’s crust consume chemicals and energy, and
emit CO2 and other greenhouse gases. For energy, two factors contribute to the specific extraction energy:
1) the dilution factor, 1/G, where G is the grade of theore, and 2) the extraction yield Y, also called the reco-
very factor, or recovery yield, wich represents the ratio of the mass of metal actually extracted, over the mass
of metal present in the treated amount of rock.
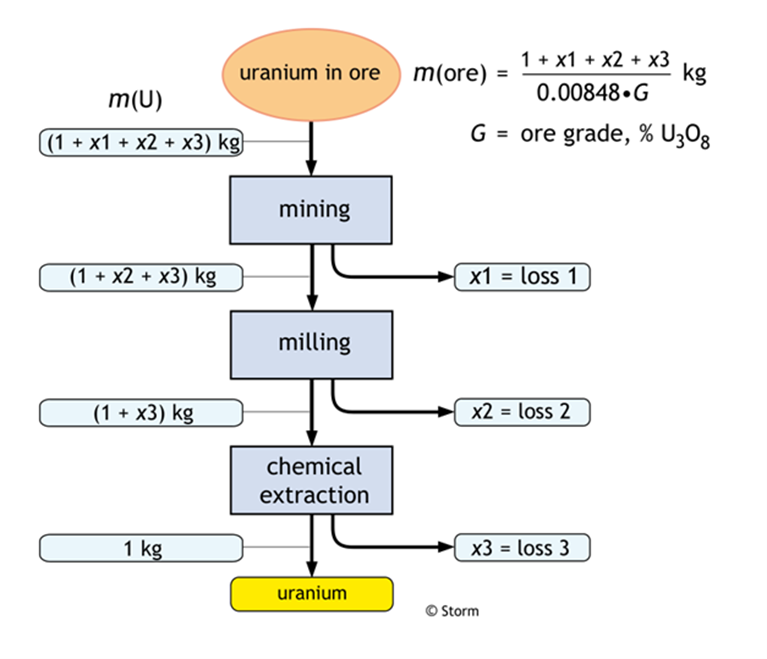
In case of an open pit mining, as it is of course for all the other technologies, losses occur at all stages of
the extraction process, as illustrated in Figure 3. More specifically, as far as the leaching and subsequent
solvent extraction phase, the lower the concentration of uranium in the liquor, the higher the entropy of the
uranium and the less complete its separation from the liquor, which means the greater is the fraction lost in the waste streams. However, a low yield may always be improved by application, if any, of more selective separation processes, but at the expense of much higher specific energy requirements.
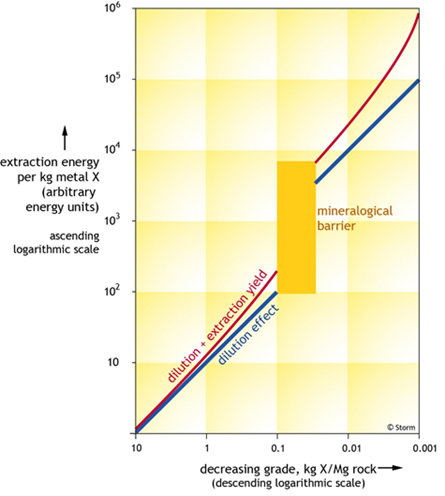
About the mineralization limit
Mineralization limit is an important notion, quite unknown and very rarely mentioned. This is a notion
that is not included, for instance, in the Red Book, even if the indications on the reserves of certain
deposits sometimes mention a consideration of extraction yields, but with little consideration on energy
expenditures.
For all natural elements, the mineralization limit corresponds to a content below which they cannot exist
in mineral form, but are present in the form of separate grains of minerals, and dispersed at atomic
scale among the other constituents of the rock. Concerning uranium, this limit corresponds roughly at
grades below 0.01% U3O8. Hence, to extract uranium from rock types below the mineralisation limit, the
whole rock has to be brought into solution. Conversely, if uranium is present as separate minerals, the
lixiviation process starts with selectively dissolving the uranium minerals, and subsequently discarding
the other minerals from the processed rocks.
To put it another way, in his book: “Extracted. How the Quest for Mineral Wealth is Plundering the
Planet” [42], Ugo Bardy defines the mineralization barrier as the threshold below which the only way to
extract an element is to work from the undifferentiated crust, what means a very important extra energe-
tical cost, compared with an extraction from ore.
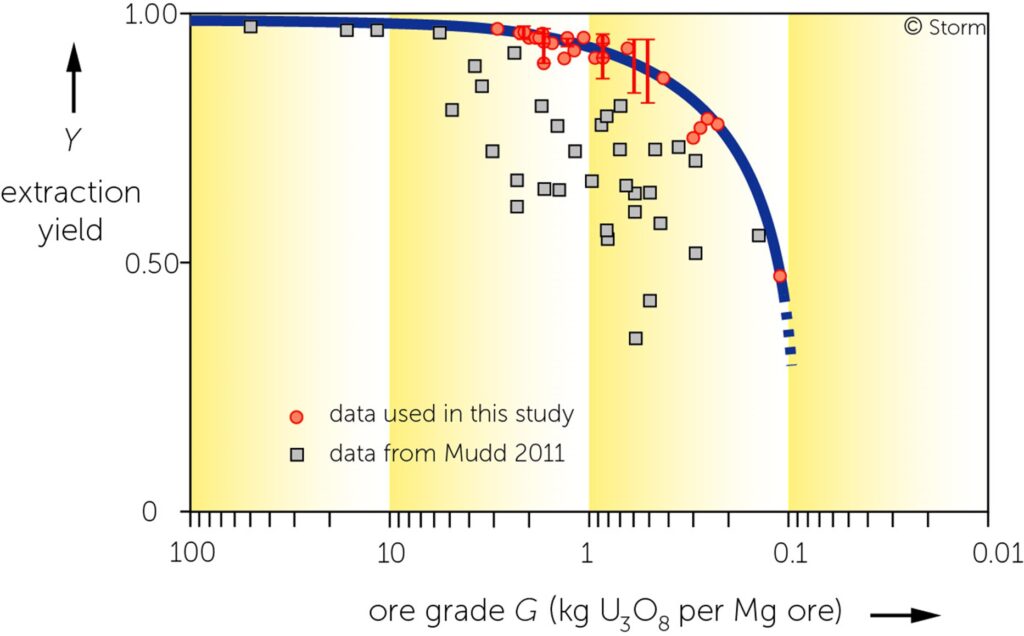
From the above considerations, it follows that it must exist a relationship between the uranium content of an
ore and its recovery rate. In order to approach this relAtionship, a large number of data from current and past
operations have been mobilised for this. This has led to the graph shown Figure 5.
The data used for this graph may seem perhaps out-dated, but during the past 4-5 decades the extraction
techniques applied in the uranium industry have not changed significantly. The study in [Mudd 2011] shows
that the blue curve in Figure 5 can be considered as the upper limit of achievable extraction efficiencies with
current extraction technologies.
The grey squares in this figure are also taken from the empirical data in [1], while the red points and bars,
which are those used in this study, have been taken from references [2] to [15].3
Energy consumption and CO2
emission of the recovery of uranium
Along with the above definitions, it follows that the specific energy consumption increases exponentially with
decreasing ore grade G, and with extraction yield Y. More precisely, the thermal energy requirements of the
recovery of one kilogram of uranium leaving the mill, Jm+m(U), as function of the ore grade G, counted in kg uranium per Mg ore, and the recovery yield Y, can be calculated via the following equation:
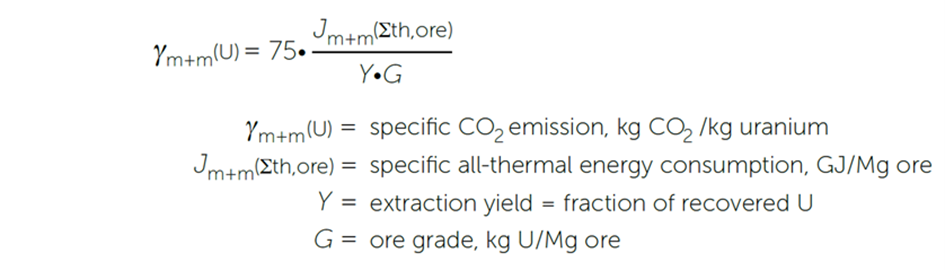
However, it should be noted here that the specific energy consumption calculated in with this equation
excludes the embodied energy of the used chemicals, namely the energy needed to fabricate the chemicals.
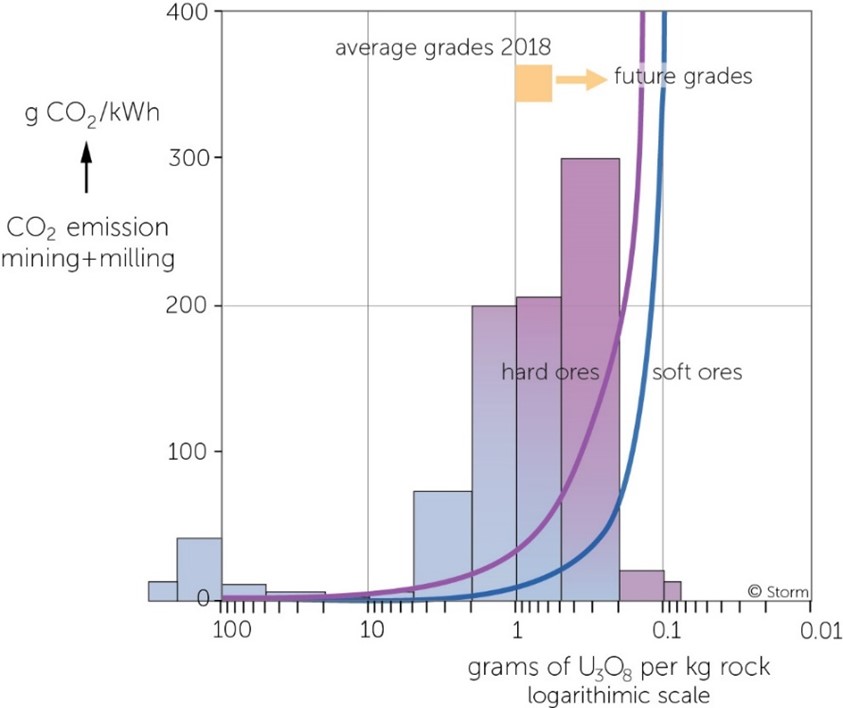
As far as the CO2 emission attached with the mining and milling of the ore, it can be simply derived from
the energy Jm+m(ore) in considering that the electricity consumed at uranium mines is generally generated
by oil-fuelled generators.4 This way, all energy inputs of mining and milling may be considered to be provided y fossil fuels.
Moreover, it will be here assumed a thermal-to-electric conversion efficiency of 40% to calculate the all-thermal energy input of mining and milling. Hence, assuming the specific CO2 emission of the used fossil fuels (diesel oil and fuel oil) is 75 gCO2/MJ, the specific CO2 emission can be calculated by the following equation:

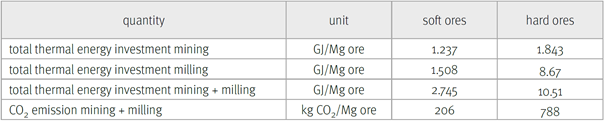
Considering the great diversity of uranium mining conditions around the world (type of deposit, type of operation, logistical chains, access to water and energy, over-burden ratios, hauling distances, etc.), the choice made for this article was limited to taking into account an “average” operation, as illustrated by the choice of the Ranger mine taken as a reference. The only distinction made here is that between “soft” and “hard” ores. This has led to the following figures (Table 1) being used for our purpose.
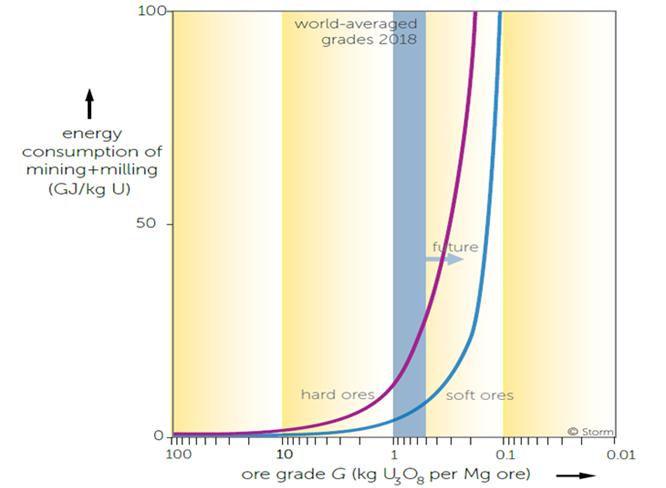
Finally, taking into account all these hypotheses and data, two graphs can be derived which illustrate:
1) the energy consumption related to the recovery of uranium (mining and milling), as function of the ore
grade (Figure 6); and 2) the CO2 emissions related to the recovery of uranium (mining and milling), again as
function of the ore grade (Figure 7).
Concerning energy, Figure 6 shows a blue band representing the grades of deposits currently in production
around the world. Obviously, because the richest ores are mined first, for these offer the highest return of
investments for the mining companies, the remaining resources will contain deposits with lower uranium
grades, and the average uranium content of available uranium resources will then decrease with time.
Toward the Energy cliff…
With regard to the energy balance of uranium extracted from ore, there is a threshold below which no net
energy production from an uranium deposit is possible. In other words, by falling below this threshold,
an uranium ore could no longer be considered as an energy source, because the extraction of, say, one kg
of natural uranium would consume more energy (noted “Einvested” hereafter, and which is limited here to the energy expended in the extraction processes alone than the energy (noted “Ereturned” hereafter) than that can be generated from one kg of natural uranium.
This can be illustrated by what is called the Energy Returned Over energy Invested5 (or EROI, see article from J. Treiner and G. Bonhomme for details). In its basic expression, it is defined as follows:
EROI = Ereturned / Einvested
from which we can easily derive the net energy pro-
duced in the extraction process, namely:
Enet = Einvested *(EROI – 1)
So, as to have a net energy positive, EROI must be superior to one, this critical value corresponding to the
threshold mentioned above. This conducts to the notion called the “energy cliff”, as represented Figure 8, based on 235U technologies, and where the net energy production of nuclear power will fall to zero.
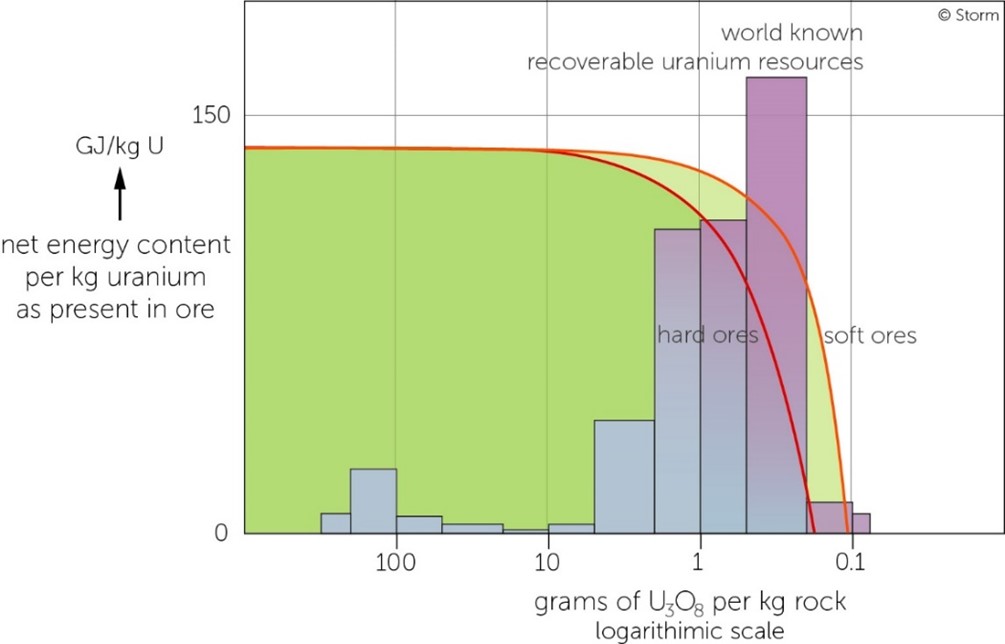
It can therefore be seen that, for U3O8 contents below 100 ppm, and considering the most favourable case
of soft ores, the net energy derived from uranium ore mining takes on negative values. It should also be noted that the variation in net energy, described as a function of the content in grams of U3O8 per kilo obtained from the uranium deposit, is simply the result of a comparison between the data presented in Figure 6, and the energical potential of one kilo of uranium, based solely on the exploitation of 235U.
Moreover, given the presence of a mineralogical barrier below the 100 ppm limit (see box above), the energy
used in the uranium extraction process is bound to increase sharply, leading to a sharp deterioration in the
energy balance. This is illustrated Figure 9 below where this energy expenditure is then multiplied by a factor of around 100.
…and toward the CO2 trap
As highlighted above, the world average available ore grade of uranium decreases with time. As a result, the
specific CO2 emission of uranium recovery, and consequently of nuclear generated electricity, rises with time,
and steeply at low grades. To put it more precisely, Figure 7 shows that at a grade of 130-100 gU/Mg ore,
and based on 235U technologies, the specific CO2 emission of nuclear recovery surpasses that of gas-fired
electricity generation, which is of the order of 400 gCO2/kWh: this is called the CO2 trap.
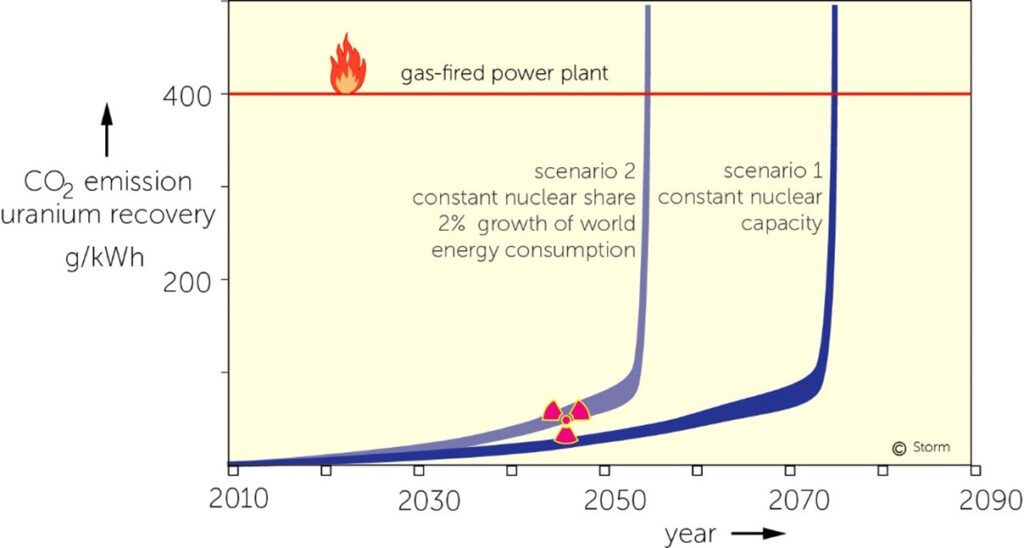
To put these figures into perspective, and assuming that the world nuclear capacity remains at the current
level, at about 370 GWe,6 the specific CO2 emission of nuclear recovery will grow to values of gas fired power
plant within the lifetime of new nuclear build. This is what is illustrated as scenario 1 in Figure 10 below.
If, instead of scenario 1, we consider a scenario 2 assuming a constant growth of 2% in the share of nuclear
power in world electricity consumption, CO2 emissions of nuclear recovery will surpass those of gas fired plants about twenty years sooner than in scenario 1, as shown in Figure 10.
About the transition
of the French nuclear fleet:
from PWR to FNR
As mentioned above, the deployment of reactors based on fast neutron technologies will hardly be possible
before the end of this century, as illustrated in Figure 11 for the French nuclear fleet. This roadmap shows one of the scenarios for the deployment of these reactors whic
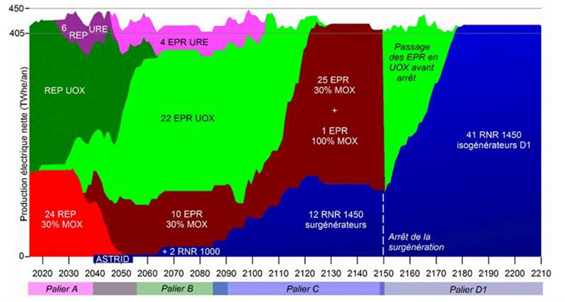
was envisaged for the French fleet in the framework of the ASTRID project. It has been defined just before the
abandonment of this project, what has thus postponed the date of deployment of such a reactor fleet.
In any case, it can be seen that, although France has the necessary tools for the reprocessing of fuels, as well
as for the manufacture of MOX fuels, the deployment of FNR-type reactors is anything but immediate. This
is even more true on a global scale, especially since a rapid deployment of FNRs would require a sufficient
quantity of 239Pu, of the order of 18 tonnes of Pu per initialized GW, which represents the Pu inventory over
the entire cycle.7 As an example, France currently has around 360 tonnes of mobilizable Pu, i.e. potentially the possibility of initializing around twenty GW of FNRs.
Conclusions
The main lesson of this article concerns the occurrence, by 2100, of a degradation of the energy ratios
(EROI) attached to the exploitation and use of 235U. If, as pointed out in the article, the data used in this article certainly need updating, this does not detract from the facts that:
• uranium is a metal that has to be extracted from the Earths crust, whose geological occurence couldn’t
suffice to make it self-evidently an energy resource;
• the amount of extraction energy per kg of uranium increases exponentially with decreasing ore grade,
so as to lead toward a negative net energy, what has been labelled “energy cliff”;
• the same holds true for the coupled CO2 emission which will finally reach and go through values
of natural gas fuelled power plant, what has been labelled “CO2 trap”.
One solution to this problem would be to turn to the use of 238U by the fateful deadline of 2100, but, as
mentioned above, this requires taking FNR technology beyond a pre-industrial stage, and thus into the com-
mercial phase, which is still not in sight. However, it is only when FNR technology is deployed that it would
be possible to solve both the nuclear energy constraint and the one attached to CO2 emissions. As we have
seen, these constraints are largely attributable to the mining and milling of natural uranium. Thus with the
use of 238U, which is already available in the form of hundreds of thousands of tonnes of depleted uranium,
these constraints would disappear, with the prospect of energy autonomy over several thousand years and, as the icing on the cake, virtually zero CO2 emissions per kWh.
References
[1] Uranium mining & CO2 accounting, AusIMM Uranium Conference, Perth, 8 June 2011, Mudd G M.
[2] Assessment of uranium and thorium resources in the United States and the effect of policy alternatives, Burnham et al., 1974.
[3] Total energy analysis of nuclear and fossil fueled power plants, Franklin et al., 23 November 1971.
[4] Statistical data of the Uranium industry, GJO-100, 1980.
[5] Extraction of uranium and thorium and other metals from granite, Huwyler et al., 1975.
[6] Ore-processing technology and the uranium supply outlook, James & Simonsen, 1978.
[7] South African uranium industry plans for expansion, James et al., 1978.
[8] Energie-analyse van de totale kernenergie cyclus gebaseerd op licht water reactoren, Kistemaker, 1975.
[9] Aanvulling op: Energie-analyse van de totale kernenergie- cyclus gebaseerd op lichtwater reactoren, Kistemaker, 1976.
[10] Uranium from the Chatanooga shale: some problems involved in development, Mutschler et al., 1976.
[11] Total energy investment in nuclear power plants, Technical Report ESL-31, Rombough & Koen, 1975.
[12] Milling technology of uranium ores, Ross & Guglielmin, 1968.
[13] Net energy from nuclear power, Rotty et al., 1975.
[14] The impact of new technology on the economics of uranium production from low-grade ores, Simonson et al., 1980.
[15] Manpower, materials, equipment and utilities required to operate and maintain energy facilities, SRI, 1975.
[16] BP statistical review of world energy 2020, www.bp.com/ content/dam/bp/business-sites/en/global/corporate/pdfs/ energy-economics/statistical-review/bp-stats-review-2020- full-report.pdf
[17] Review of environmental impatcs of the acid in-situ leach uranium mining process, CSIRO 2004, http://large.stanford.edu/courses/2018/ph241/bashti1/docs/csiro-aug04.pdf
[18] Ranger operation, energy resources of Australia Ltd (ERA), 2006, http://www.energyres.com.au
[19] Valencia Uranium Deposits, Forsys 2007, www. forsysmetals.com
[20] Valencia Project, Namibia, 2007, www.forsysmetals.com
[21] An environmental critique of in situ leach mining: The case against uranium solution mining, Mudd G, 1998, https://users.monash.edu.au/~gmudd/files/1998-07-InSituLeach-UMining.pdf
[22] Uranium 2007: Resources, Production and Demand, Red Book 2008.
[23] Uranium 2019: Resources, Production and Demand, Red Book 2020.
[24] Guidebook to accompany IAEA map: world distribution of uranium deposits, IAEA, Vienna, 1996.
[25] Energy return on investment, WNA-eroi, 2016, http:// www.world-nuclear.org/information-library/energy-and-the- environment/energy-analysis-of-power-systems.aspx
[26] Data world uranium mines outside China and Soviet union, Nuclear Assurance Corporation, Zürich, 1982.
[27] The energy analysis of burner reactor power systems, Mortimer N D, 1977.
[28] World nuclear capacity in 2021, World nuclear performance, 2022, WNA.
[29] Sustainability aspects of uranium mining: Towards accurate accounting? Mudd G M & Diesendorf M, 2007.
[30] Uranium mining in Australia and Canada, WNA, March 2007, www.world-nuclear.org/
[31] In situ leach (ISL) mining of uranium, WNA, July 2014, https://world-nuclear.org/information-library/nuclear-fuel-cycle/mining-of-uranium/in-situ-leach-mining-of-uranium.aspx
[32] Uranium mining overview, WNA 2016, http://www.world-nuclear.org/information-library/nuclear-fuel-cycle/mining-of-uranium/uranium-mining-overview.aspx
[33] Australia’s uranium and who buys it, WNA, February 2006, www.world-nuclear.org/
[34] Preliminary assessment on nuclear fuel cycle and energy consumption, Orita Y, 1995.
[35] Supply of uranium, WNA-75 2010, updated November 2016, www.world-nuclear.org/
[36] Uranium in Canada, WNA, May 2011, www.world-nuclear. org/
[37] Geology of uranium deposits, WNA-Ugeol 2015, Geology of uranium deposits – World Nuclear Association.pdf, http://www.world-nuclear.org/information-library/nuclear-fuel-cycle/ uranium-resources/geology-of-uranium-deposits.aspx
[38] Trekkopje EIA, Turgis Mining Consultants, November 2007, https://www.mining-technology.com/contractors/project/turgis-consulting/
[39] Australia’s uranium deposits and prospective mines, UIC, May 2005, www.uic.com.au/pmine.html
[40] WISE Uranium Project, 2015, www.wise-uranium.org
[41] Impacts of uranium in-situ leaching, WISE Uranium Project, 2015, http://www.wise-uranium.org/
[42] Extracted. How the quest for mineral wealth is plundering the planet, Ugo Bardy, 2014.
More details on the subjects addressed in this article can be
found in the following reports on: www.stormsmith.nl [reports]:
m01 Uranium-Plutonium breeder systems
m20 Reprocessing of spent fuel
m24 Thorium for fission power
m26 Uranium mining + milling
m27 Unconventional uranium resources
m28 Uranium from seawater
m29 Uranium for energy resources
m35 Energy cliff and CO2 trap
m44 Process analysis of the Ranger mine