
By François RODDIER
French physicist and astronomer
And Mireille RODDIER
Associate professor and program director of architecture, University of Michigan
Complex system studies have shown that, under a sufficient flow of energy, dissipative structures appear
and self-organize into periodic oscillations characteristic not only of Carnot cycles, but also of biological
and economic cycles. We have also seen that the emergence of such cycles is the outcome of a common
thermodynamic process known as the principle of maximum entropy production (Roddier, 2012). What
happens when the flow of energy, which the system has structured itself to dissipate most efficiently,
significantly decreases? Here we argue that this unsolicited shortage might be salutary to our interconnected
ecosystems if we learn to couple our centrifugal phases of innovation and production with antagonistic
centripetal phases of restauration and maintenance. Otherwise, whether we continue to exponentially
consume energy from unforeseen new sources, or too abruptly cease all energy consumption without a
process of adaptation, our globally interconnected ecosystems may prove too fragile to recover.
“A people can be just as dangerously overpowered by the wattage of its tools as by the caloric content of its
foods, but it is much harder to confess to a national overindulgence in wattage than to a sickening diet. (…)
Calories are both biologically and socially healthy only as long as they stay within the narrow range that
separates enough from too much.” – Ivan Illich, Energy and Equity (1973).
Thresholds and critical points
In the wake of the half-century anniversary of the Club of Rome’s report “The Limits to Growth”, another text
of obstinate relevance recently celebrated its 50th anni- versary with a fresh new edition: Ivan Illich’s Tools for
Conviviality. In the first chapter, Illich introduces his concept of threshold as the limit beyond which innova-
tions in science and technology create more damage than they can resolve. He swiftly followed up with the
publication of the essay Energy and Equity (Le Monde, 1973) in which he elaborated upon the example of
motorized traffic to illustrate the risks naturally posed by a surplus of affluence and/or energy flow.
Let’s borrow the scenario. Imagine a highway mildly busy with a continuous flow of cars traveling at a
constant velocity. As the volume of cars increases, the traffic reaches a point where it cannot maintain its
speed constant: unpredictable episodes of periodic deceleration and acceleration begin to appear. The
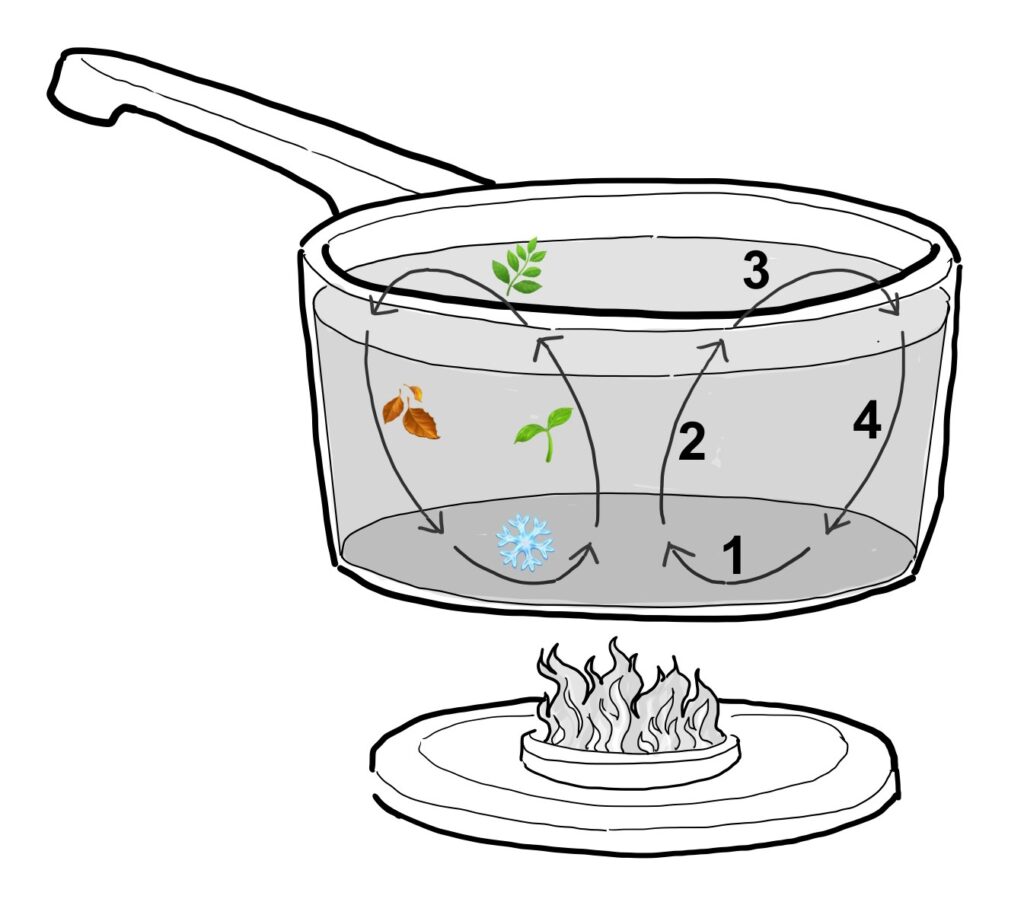
return to a continuous flow necessitates reducing either the volume or speed of cars or increasing the number of lanes. It can be posited that, for a specific flow (volume of cars per number of lanes), a critical speed limit can be determined beyond which traffic becomes unstable and increasingly more chaotic. Similarly, the temperature of a specific volume of water under a specific heat flux will rise linearly by conduction until a critical point, beyond which cyclical convection currents appear, characteris-
tic of a phase transition. If the heat flux due to conduction is proportional to the temperature gradient within
the pot of water, we see that past the critical point, the heat flux due to convection is exponential, proportional to the square of the gradient.
To generalize: under a critical point, an energy flow is proportional to the gradient of a scalar quantity, be it
temperature, pressure, time, speed, wealth, etc. As long as the gradient remains small, the flow remains
proportional and laminar. The dissipation of energy is linear. Once the gradient exceeds its critical value, the
energy flow grows much faster than the gradient and dissipates non-linearly. The study of non-linear systems, or complex systems, gained the increased attention of physicists in the second half of the 20th century. Ilya Prigogine coined the term dissipative structure to reference the spontaneous appearance of complex and orderly if unpredictable dynamic structures that emerge when a sufficient energy flow sets a thermodynamic
system in a state of non-equilibrium. Such structures can take the form of convection cycles when a pot of
water is on the stove; of cyclones when high pressure gradients create strong enough winds; of planetary
hydrologic and seasonal cycles as generated by the temperature gradient between the heat of the sun and
the 3ºK cosmological background that can substantially absorb it; of life cycles themselves as first theorized
by Prigogine; of boom-and-bust economic cycles as further postulated by Benoit Mandelbrot. These peri-
odic structures are sustained by a continuous flow of energy. Prigogine showed that dissipative structures
self-organize in order to maximize their dissipation of energy – or to maximize their production of entropy. For example, the temperature difference between the poles and the equator would increase beyond stability were it not for the formation of atmospheric currents which self- organize as a means to redistribute heat from the equator towards the poles, breaking down into smaller currents along the way. Plants, just like animal bodies or societies, self-organize in order to dissipate their energy most efficiently, maximizing their entropy production (Roddier, 2012). The Danish physicist Per Bak illustrated self-organized criticality with grains of sand being poured into a pile, as in an hourglass. Up-close observations reveal that
when the sand exceeds a critical slope, avalanches occur, returning the slope to, or possibly below its critical value. Thus, the slope of the sand pile randomly oscillates around its critical value without ever sta-
bilizing. Per Bak showed that, just like avalanches, earthquakes, forest fires, epidemics, mass-extinctions,
traffic jams, neural activity and economic cycles all fluctuate around their respective critical values according
to a “1/f noise”, meaning that, for example, the amplitude of earthquakes along a fault line are inversely pro-
portional to their frequency. Per Bak, an expert in phasetransitions, compared the process of self-organized
criticality to the phase transitions observed in a fluid when its state oscillates near the critical point between
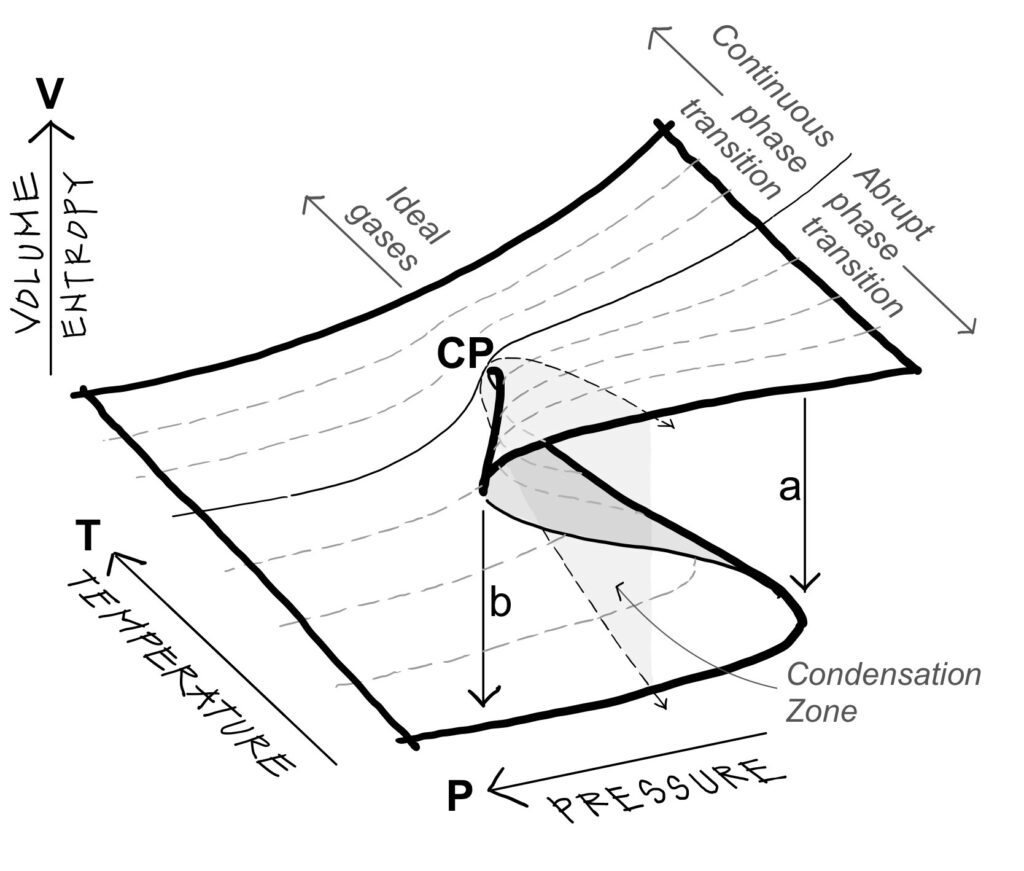
a liquid and a gaseous phase. The temperature and pressure of critical points vary greatly from one fluid to another. Fluids with high critical points are the most condensable. Fluids with lower critical points, such as carbon dioxide (5 atm and 31.3ºC) are much less condensable and behave closer to ideal gases. Figure 1 shows that above the critical point, the isotherms tend towards those of ideal gases: a hyperbolic surface defined by the equation of state P.V = nR.T, where P is the pressure, V the volume, T the temperature, and n is the number of moles of the substance. R is a universal constant for ideal gases close to 8.31 Joules/K. Below the critical point, the isotherms contain a zone of condensation in which liquid and gas
phases coexist. The Dutch physicist Johannes Van de Waals introduced the first equation of state for real
gases which represented the behavior of gases when condensed into liquids. The Van der Waals equation,
(P + a/V2).(V-b) = n.R.T, adds two corrective terms a and b to that of ideal gases – one to the pressure and
the other to the volume. Figure 1 shows that below the critical point, the isotherms of Van der Waals corre-
spond to the unstable condensation zone that characterizes an abrupt phase transition.
Phase transitions
Physicists distinguish between abrupt phase transitions and continuous phase transitions. Continuous phase
transitions are observed just above critical points, which are defined by specific pressures and temperatures
per fluids. For example, below its critical point, water boils into vapor with the initial appearance of bubbles
and vapor condenses back into water by first forming water droplets or fog. These are abrupt phase transi-
tions between a liquid and a gas state. Above its critical point at a pressure of 220 atm and temperature of
374ºC, the liquid and gas parts reach the same density, forming a homogeneous fluid that creates a continuous transition between liquid and gas phases. The lightreflecting surface that previously separated the denser liquid from the less dense gas disintegrates and the fluid itself starts to scatter light – a phenomenon known as critical opalescence. If the temperature is then cooled below the critical point, droplets form and grow. Denser than the rest of the fluid, they fall to the bottom. The temperature and pressure of critical points vary greatly from one fluid to another. Fluids with high critical points are the most condensable. Fluids with lower critical points, such as carbon dioxide (5 atm and 31.3ºC) are much less condensable and behave closer to ideal gases. Figure 1 shows that above the critical point, the isotherms tend towards those of ideal gases: a hyperbolic surface defined by the equation of state P.V = nR.T, where P is the pressure, V the volume, T the temperature, and n is the number of moles of the substance. R is a universal constant for ideal gases close to 8.31 Joules/K. Below the critical point, the isotherms contain a zone of condensation in which liquid and gas phases coexist. The Dutch physicist Johannes Van de Waals introduced the first equation of state for real gases which represented the behavior of gases when condensed into liquids. The Van der Waals equation, (P + a/V2).(V-b) = n.R.T, adds two corrective terms a and b to that of ideal gases – one to the pressure and the other to the volume. Figure 1 shows that below the
critical point, the isotherms of Van der Waals correspond to the unstable condensation zone that charac-
terizes an abrupt phase transition.
We have previously explained how, just like fluids, living organisms and ecosystems self-organize into dissipative structures to maximize their energy dissipation (Roddier, 2012). Van der Waal observed that for real gases, pressure had to be increased with an additional value inversely proportional to the volume (a/V2) due to the dipole forces of attraction between molecules. In the case of living organisms, the reaction is not electrostatic but chemical, and enzymes replace electrons as the catalyst that accelerate the cycles. We have further expounded the ways in which money serves as the catalyst for the self-organization of economic cycles, just as language does for our societies (Roddier, 2018). We will come back to them.
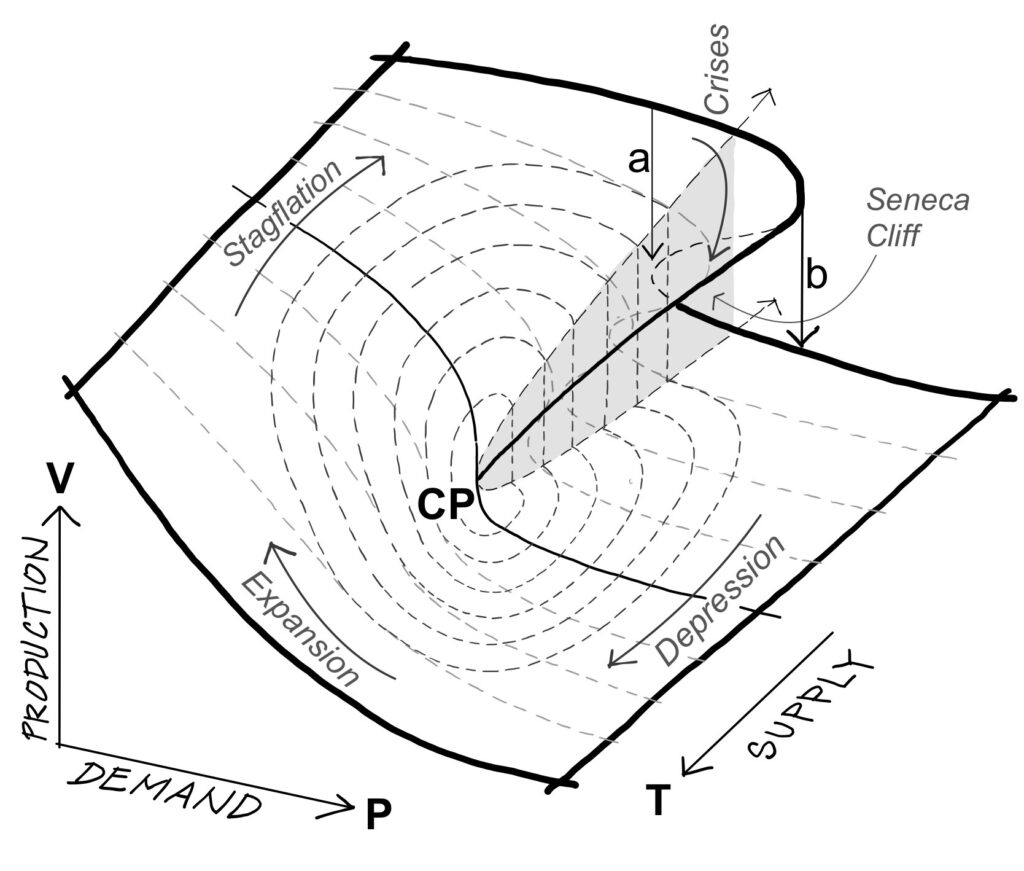
Figure 2 transposes the terms of Figure 1 to the economy. The concept of “temperature” in the economy
can be defined as the amount of energy necessary to produce a unit of entropy (Roddier, 2015). If money is
a measure of information and entropy measures the loss of information, we can measure the production
of entropy in the economy in terms of money spent. The temperature of the economy is inversely proportional to the cost of energy. In Figure 2, the variable Trepresents supply, which increases proportionally to a product’s exchange value. The variable P represents demand, which increases proportionally to use value. As the figure shows, when energy influx increase supply, heating the economy beyond the critical point, the volume of production is inversely proportional to the demand, and the isotherms turn into hyperbolas. When applied to the economy, Van der Waals’s supplemental value a/V2 originally applied to specific molecules in gases is now applied to specific goods, the economic potential of which is inversely proportional to its production volume, such as distribution services like communication or public transportation. The minimal volume of production “b” insures the survival of the system. The fold in the surface reflects what the topologist mathematician René Thom called fold bifurcations – structurally unstable catastrophe geometries. Applied to the economy, it refers to a crisis phase. The point CP refers to the critical point around which the economy follows clockwise cycles of oscillations between continuous phases of growth and abrupt transitions of recessions.
Economic life cycles
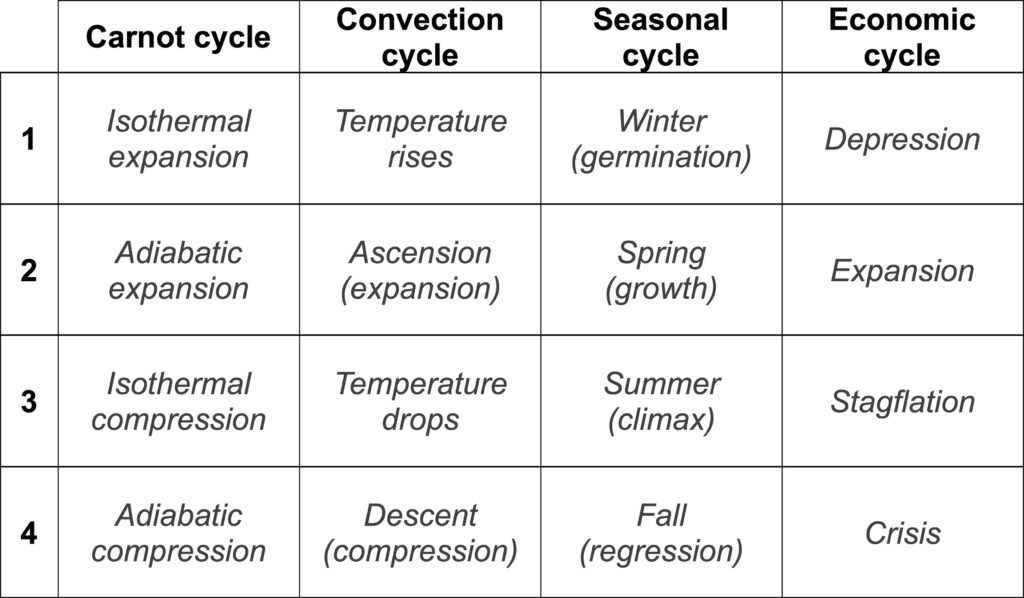
We have seen that economic cycles self-organize like convection cycles in a pot of boiling water (or like any other Carnot cycle). Such types of cycles can be divided into four clear phases compared in Figure 3. In
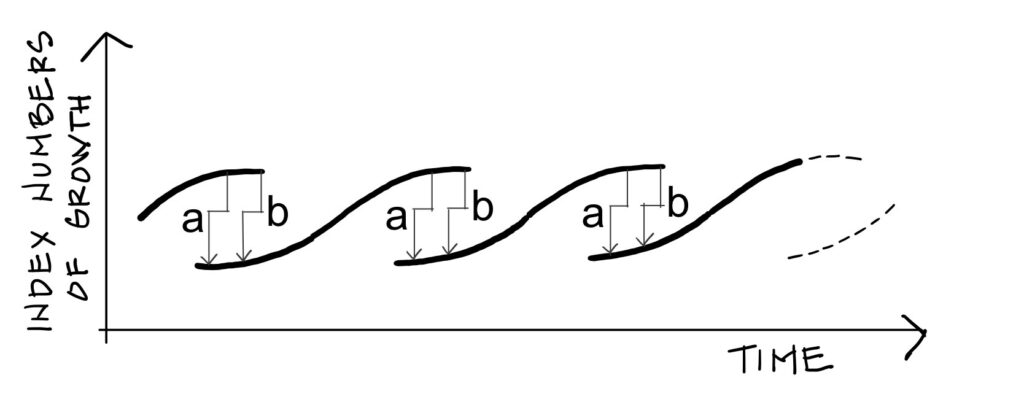
reference to the economy, the four cycles have been described along the four consecutive phases: depression, expansion, stagflation, and crisis (Turchin and Nefedov, 2009). In the late 1970s, the German eco-
nomist Gerhard Mensch had already described the process through which phases of innovation always
followed economic crises through what he called a “metamorphosis model of long-term instability”. His
model, reproduced in Figure 4, shows that during the crisis phase, two economies co-exist in the same way
that liquid and gas co-exist in the same fluid during an abrupt phase transition. At any time, production can
drop from the upper level down to the lower level from which a new economy emerges. Mensch’s arrows a
and b, between which successive economies overlap, correspond to the arrows of the same name in Figure 2
(Van der Waals’s corrective terms).
As the economy cycles around the critical point, we can verify Bak’s 1/f noise distribution: the frequency of the crises is inversely proportional to their magnitude. The smaller and more autonomous an economic system–i.e. the tighter it cycles around the critical point – the less significant its collapse. The more global and inter-connected a system, the more efficient it becomes but also the more fragile, leading to avalanche catastrophes that affect entire ecosystems. The Italian physicist Ugo Bardi coined such collapses “the Seneca Effect”, after the Roman philosopher who first observed the pattern. The biologist Robert Ulanowicz similarly observed how, past an optimal degree of interconnectivity, natural eco- systems quickly tend towards collapse. We noted above how cycles of energy dissipation are accelerated through autocatalytic processes. By studying trophic interactions in biological ecosystems, Ulanowicz observed how, when energy and material resources are abundant, they are drawn into centrifugal growth-enhancing autocatalytic cycles which necessitates a continuously increasing amount of material and energy flow to sustain. On the other hand, under declining availability of external resources, flows are rerouted into a closed configuration that only engages equipon-derant transfers. We see how the structures oscillate between open dissipative systems, which become very fragile, and closed configurations that tend towards a (dangerous) state of equilibrium. For Ulanowicz, although shortages in energy and resources may lead a system towards decay and disintegration, if the decline is gradual enough, fragmentary subsystems can reach a harmonic stability when sustained by the coupling of cycles in opposite phases of expansion and recession – pairs whose opposite behavior patterns are, paradoxically, a form of collaboration.
For example, imagine riding a bicycle at a fast pace: it’s easy enough to imagine that your speed can be maintained using only one pedal. Now if you are faced with a hill, you will have recourse to the second pedal in order to avoid falling over. In the same way, the 2CV Citroën sets its two cylinders in opposite phases of expansion and compression. The biologist Élie Bernard-Weil called these Ago-Antagonistic Systems – referring to systems that are cooperating (agonistically) by acting in opposition (antagonistically).
Ago-antagonistic couples
Biologists have observed the ubiquity of ago-antagonistic mechanisms in nature. These binary systems
monitor and regulate our energy dissipation. Think of our bodies: glucose (sugar) is one of our principal
sources of energy. Our pancreas produces both insulin and glucagon, respectively reducing or increasing our
sugar levels as needed, since both surplus and short-age can be lethal. Our system also distinguishes two
separate nervous systems, the sympathetic and parasympathetic. One sustains our need for activity (flight or
fight), the other for rest. Together, they maintain a tight equilibrium midway between workaholism and chronic fatigue – both on the rise in high energy consuming societies. Oil can be seen as the glucose of our societies, and we are as addicted to it as children can be to candy, alternating between sugar highs and sugar
crashes. What form can insulin take for our collective? Regardless of resource limitations, our energy
consumption ineluctably needs to diminish for our collective wellbeing. While it could lead to our extinc-
tion as some predict, the end of abundance could also lead our societies towards a more holistic self-
care, one that undiscernibly includes the wellbeing of all the ecosystems in which we partake. This would
require finding and maintaining the narrow equilibrium between our efficiency (our ability to mass-
process volumes of relevant matter-flow, energy-flow and information-flow) and our resilience (the capac-
ity to adapt to deviations, privilege flexibility, diversity, and non-transactional interactions).
Whether we consciously prepare for the emerging transition, or whether we are more violently forced into it
because of shortsightedness or denial, the “parasym-pathetic” half of our global system is gaining traction. In
opposition to a phase of growth, we can qualify it as a phase of restauration, maintenance, and care. We will
credit Ivan Illich for calling attention to the concept of vernacular values (Illich, 1981). The vernacular realm,
in Illich’s definition, expands and contracts in opposition to what he calls the shadow economy. Vernacular activities – whether in the form of information (language, currency), material, or energy flows – entirely resist and oppose the terms of industrialization, standardization, or growth. To globally normative, mass-produced buildings, we can oppose vernacular architecture, which foregrounds the use of local materials in response to
local climatic conditions. To the mass-standardization of our commodities and taste, which lose relevance
over time, we can oppose the idiosyncratic constructs and local knowhow that result from specific needs,
and which gain value with generations. To vehicular languages, the linguae francae of trade that max-
imize imperial expansion, we can oppose vernacular languages, the living dialects that evolve to maximize
and maintain diversity. To global currencies we can oppose vernacular currencies, complementary systems
of exchange, that, as the economist Bernard Lietaer made clear, soften the rigidity of an economic system
that only accommodates a small concentration of our populations (Lietaer et al., 2012).
Complementary currencies should operate in collaboration with and in opposition to dominant curren-
cies: where the later foster competition, future speculation, monopoly, anonymity, exchange value, and
increase over time when stocked, the former must privilege collaboration, unmediated transactions, diver-
sity, community, use-value, and a decrease in value when stocked, prompting continuous redistribution.
Both Lietaer and Ulanowicz have qualified the mechanism that regulates efficiency as having yin qualities,
whereas the autocatalytic process that maximizes it holds yang qualities.
We have already suggested that, as energy supplies dwindle and the temperature of the economy shrinks,
the value of a new complementary currency would lay the groundwork for a future economy (Roddier, 2015).
This new currency would be useless, unless it performs in complementary and oppositional ways to the dominant currency: being utilized for food, service, salaries, and renewable energies, and saving the Euro (Dollar, etc.) for the purchase of commodities and withering stock energies, while taxing both forms of currency differently as a way to privilege necessary incentives. Just like a linguistic system or an urban structure, a monetary system is an ideological tool that privileges certain flows over others. The more we utilize such tools to prepare for the rise of the incoming yin society, the easier and less violent our transition.
Bibliography
BAK P. (1996), How nature works: The science of self-organized criticality, New York, Springer. BARDI U. (2017), The Seneca effect, Springer. BERNARD-WEIL E. (1994), « La théorie des systèmes ago-antagonistes », Le Débat, 106(4), pp. 106-120. ILLICH I. (1973), Tools for conviviality, Harper & Row. ILLICH I. (1974), Energy and equity, Harper & Row. ILLICH I. (1981), Shadow work, London, Marion Boyars. LIETAER B., ARNSPERGER C., GOERNER S. & BRUNNHUBER S. (2012), “Money and sustainability – The missing link”, A report from the Club of Rome, Axminster: Triarchy Press Ltd. LIETAER B. (2018), Créer une monnaie complémentaire, Lormont, Le Bord de l’eau. MENSCH G. (1979), Stalemate in technology, Cambridge, MA, Ballinger. RODDIER F. (2012), Thermodynamique de l’évolution, Artignosc-sur-Verdon, Éditions Parole. RODDIER F. (2015), « La thermodynamique des transitions économiques » (video), Think tank workshops, The Shift Project, March 12.
RODDIER F. (2018), De la thermodynamique à l’économie – le tourbillon de la vie, Artignosc-sur-Verdon, Éditions Parole. TURCHIN P. & NEFEDOV S. A. (2009), Secular cycles, Princeton, NJ, Princeton Press. ULANOWICZ R.E. (2009), “Increasing entropy: Heat death or perpetual harmonies?”, International Journal of Design & Ecodynamics, 4(2), pp. 83-96.